In this post I’m going to briefly run through how to get Xdebug working with the WordPress core project and VSCode.
Prerequisites:
- Clone and setup the WordPress/wordpress-develop project (Instructions are in the project README)
- Install Xdebug browser extension
- Install VSCode
- Install the PHP Debug extension in VSCode
Update .env variable
Go to the file wordpress-develop/.env and update the variable LOCAL_PHP_XDEBUG variable:
# Whether or not to enable Xdebug.
LOCAL_PHP_XDEBUG=trueAdd php-config.ini variables
Go to the file wordpress-develop/tools/local-env/php-config.ini and add the following variables:
xdebug.remote_enable=1
xdebug.remote_connect_back=1Create VSCode launch.json config
Go to the Debug tab in VSCode and if you haven’t already got a launch.json config file create one. If prompted with the question of ‘type’ select PHP.
You’ll need to add the following pathMappings property:
"pathMappings": {
  "/var/www": "${workspaceRoot}",
}The entire configuration should look something like this:
{
    "version": "0.2.0",
    "configurations": [
        {
            "name": "Listen for Xdebug",
            "type": "php",
            "request": "launch",
            "port": 9003,
            "pathMappings": {
                "/var/www": "${workspaceRoot}",
            }
        }
    ]
}Start debugging
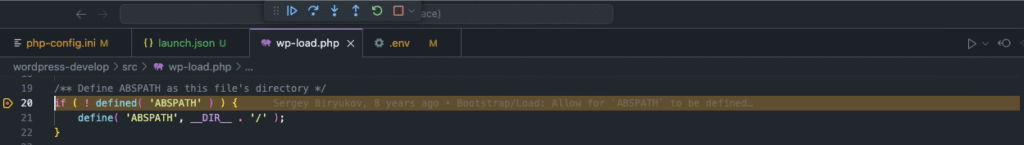
Now we’ve got the correct setup, lets set a breakpoint somewhere in the codebase we know we’re going to hit. I’ll set mine at the first line of code in wp-load.php.
Now on the Debug tab of VSCode we can hit “Listen for Xdebug (wordpress-develop)“

Now in your browser Enable debugging in the Xdebug browser extension and reload the page.
This should trigger the breakpoint in VSCode.
Leave a Reply